Zum Seitenende Übersicht Artikel Home & Impressum
First the link to this week’s complete list as HTML and as PDF.
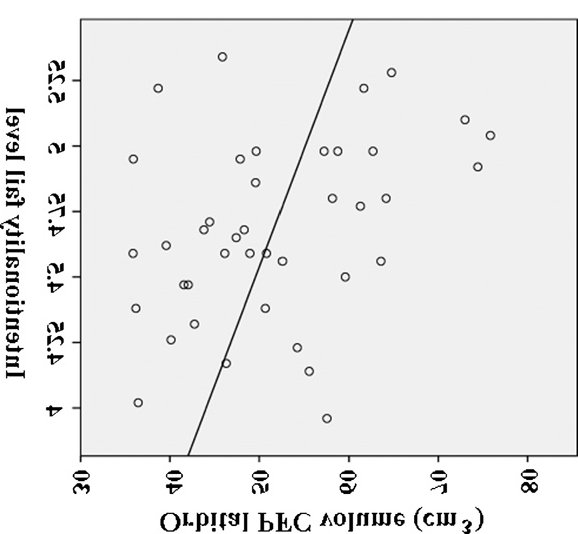
Powell et al. 2012 sounds interesting and seems to confirm a well accepted hypothesis. Going into the details though, there is no significant correlation between the cause and effect values and what there is points in the wrong direction.[1] The article doesn’t show a single meaningful diagram and for one of the main variables, intentionality, the methods section gives no hint of how it was determined. Building a chain of steps with r2s of .13 and .05 and expecting that to transport a meaningful level of causality is beyond ridiculous.
So by all means the hypothesis is disproved and cultural and personality factors seem to trump cognitive ability, if that’s what the PFC site measures that is.
At first sight their older article of 2010 looks much better. In their figure 2a there definitely is a correlation and it does not hang on a few outliers alone. But wait, they have cause and effect reversed here and the main text leaves no doubt that this is indeed what they have been doing.[2] It is this, reversed, value that they use in their later article making it meaningless, as the causality in their fig. 1, if existent, would point from the centre outwards in both directions and not along a chain from left to right. Turning their diagram 2a into the correct position we lose most of the correlation, what there is mainly hangs on the three outliers to the right with more than 70 cm3, and no relation whatever is seen below 60 cm3.

Happily Robin Dunbar’s theses do not rely on Powell, though it probably was wishful thinking that made him see neuroanatomical support for his ideas where none exists.
In their search for old DNA Vernot & Akey employ tests with specificity and sensitivity so low, they’d be totally out of the question for e.g. medical tests. While considering it highly improbable (though possible[3]), that their results could be purely spurious, I recommend viewing their individual results with caution until confirmed by other, independent data.
Couzin-Frankel first reports results for rodents, seed eaters, whose metabolism is necessarily different from our meat eating one. (From the australopithecines on starchy grass roots, accessible only with digging sticks, became seasonally important but never in the amounts that became common in the last 9 000 years only.)
Her second example has a risk ratio of less than 2 with no correction for confounders at all.
Heather Pringle repeats the press release about the artefacts buried with the Clovis Anzick boy having been old heirlooms. While not impossible, the two dates on human bone and reindeer antler are not in fact statistically different and small differences of large numbers are the least exact of all measurements.